Animation of rates from 5-yr ppn data for Hungary and Slovakia (Chpt. II) and profile projections for Ukraine (Chpt. IV).


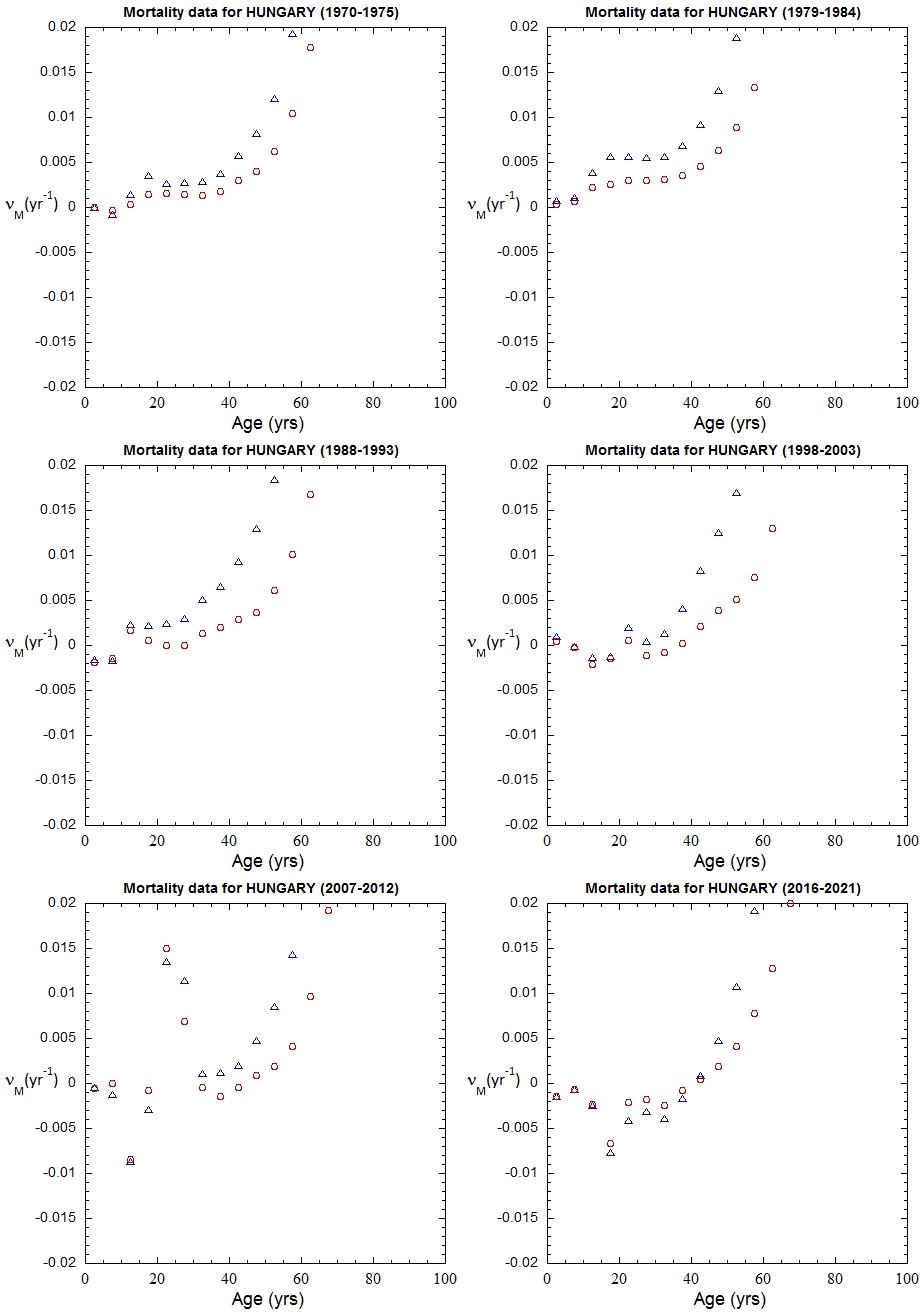
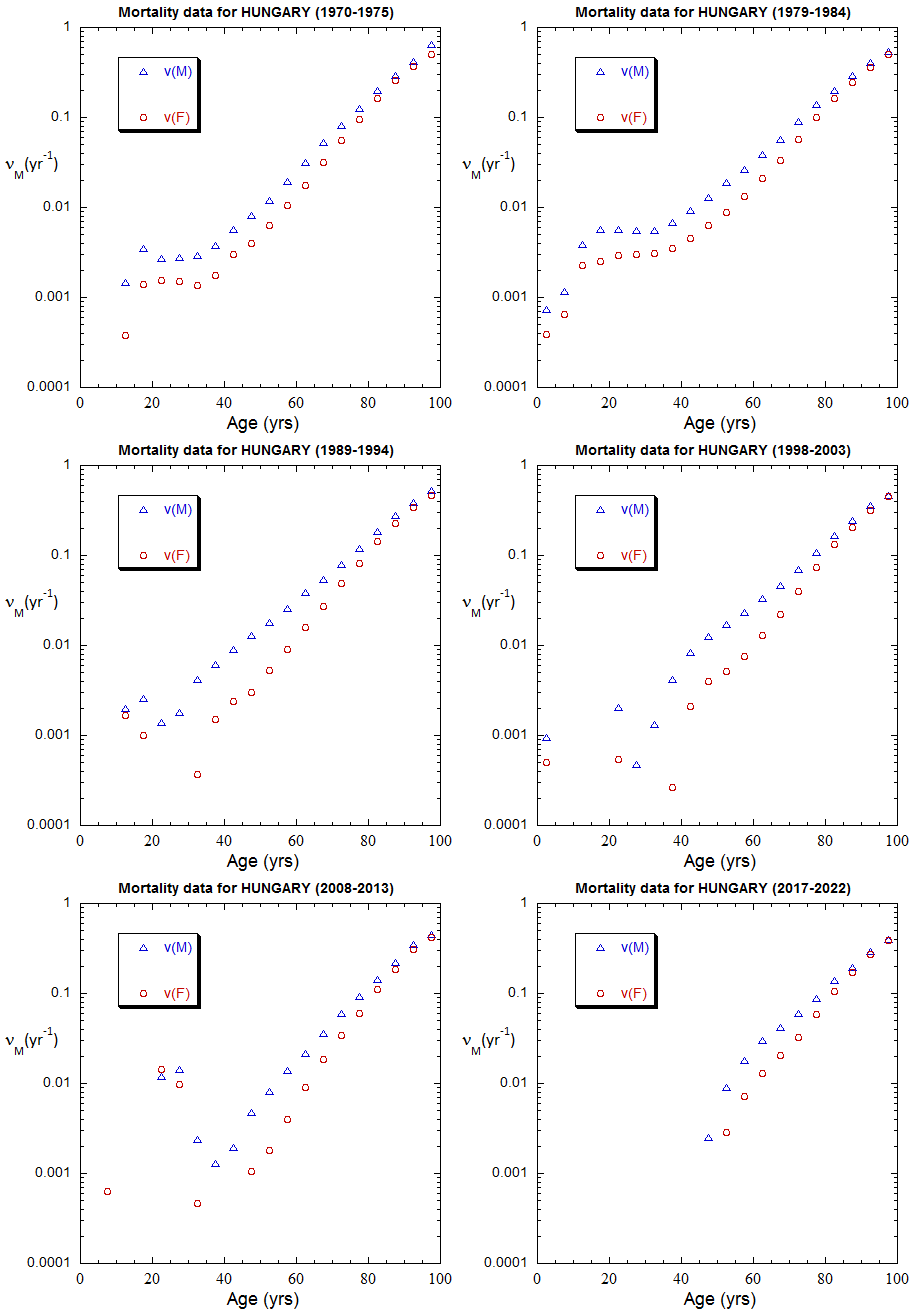
Figure II.2. Mortality rates inferred from population data for Hungary from 1970-2020, plotted on a linear scale (left) and a logarithmic scale (right).


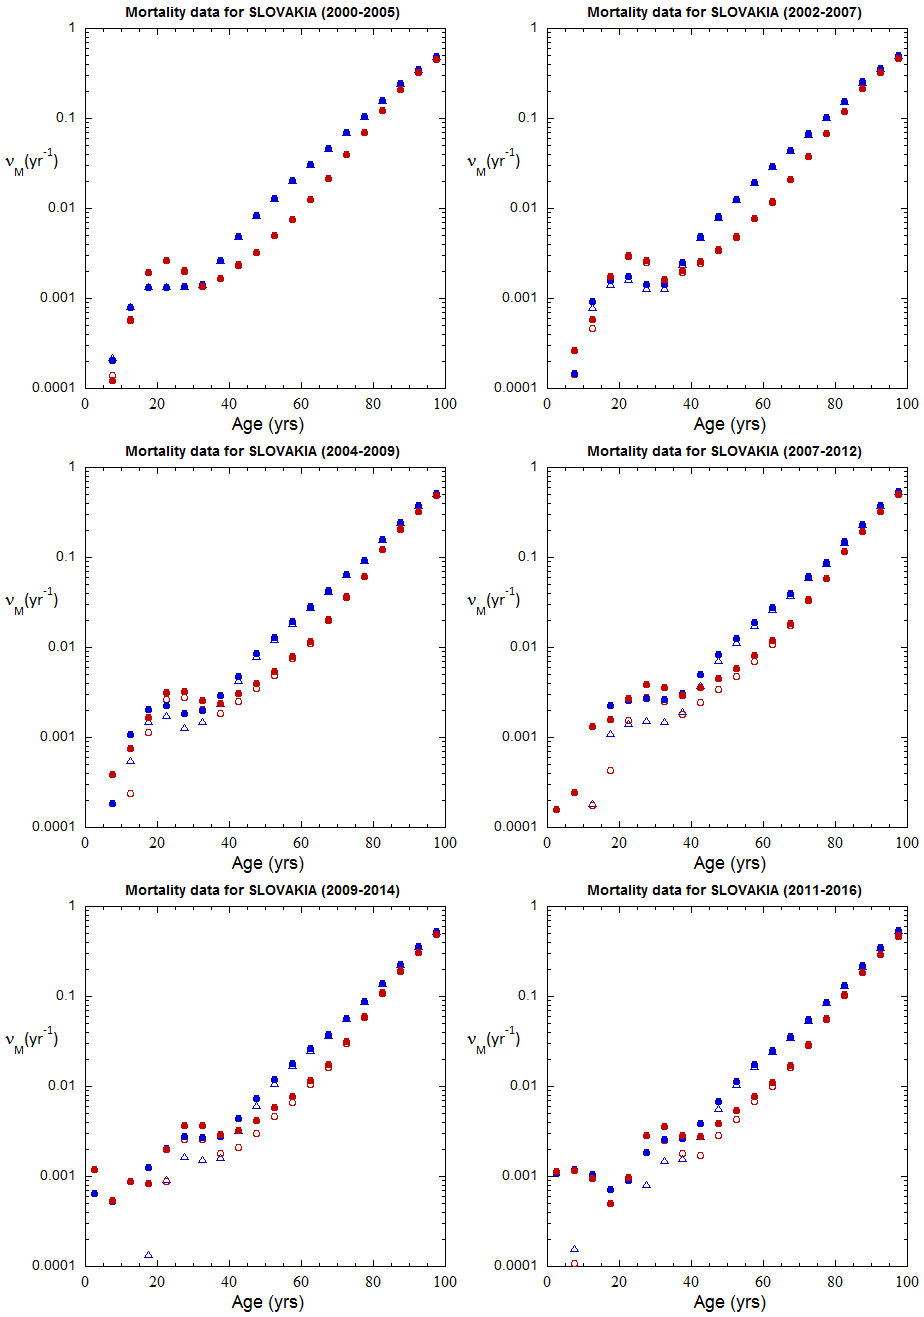
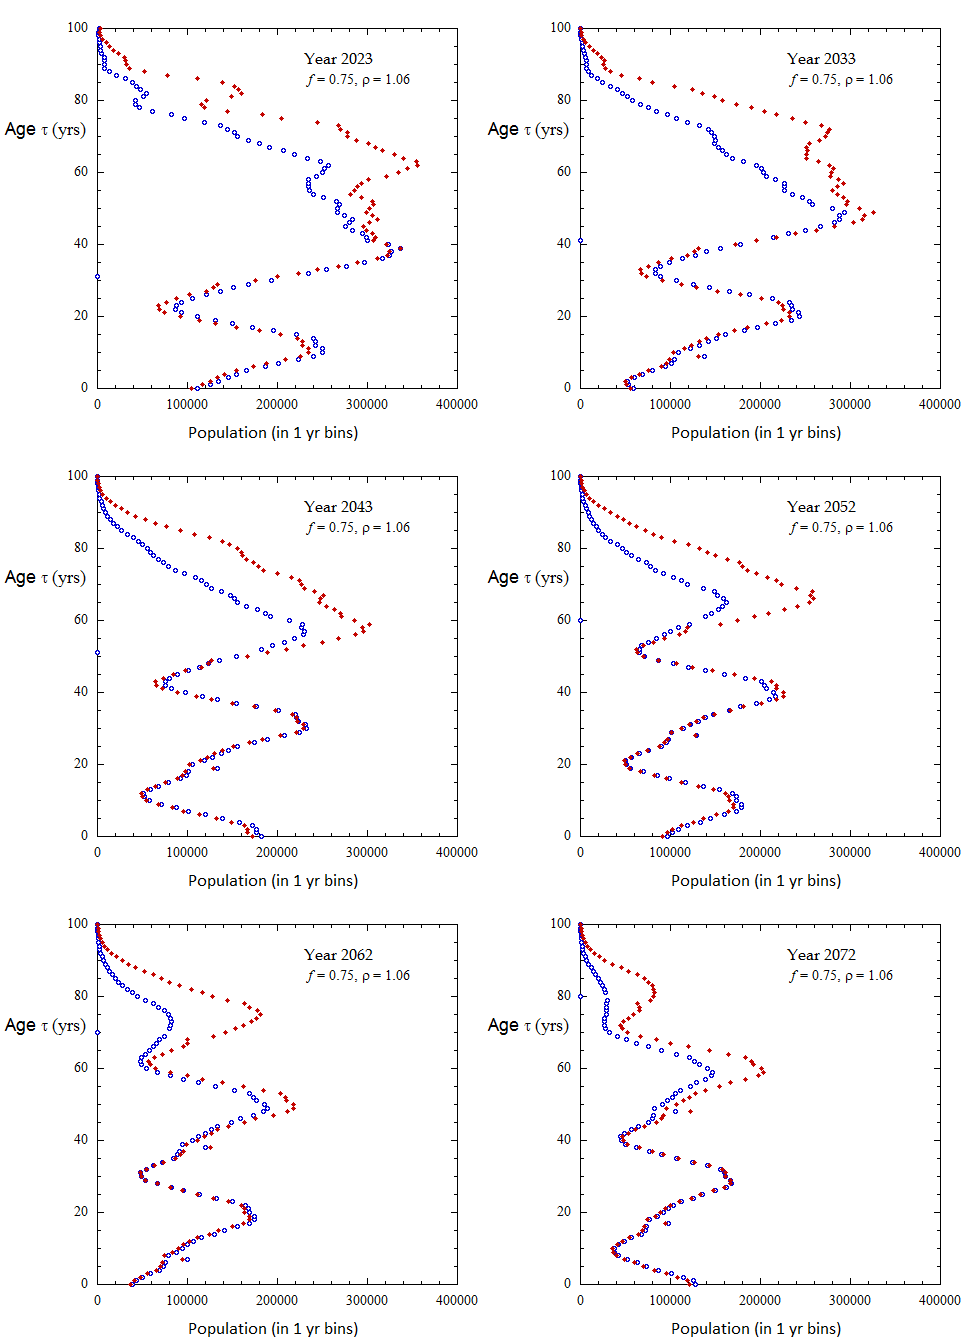
Fig. II.3 (left). Rate animation for Slovakia. Figure IV.B1 (right). Projected Ukrainian population profiles from 2024 to 2072, for Scenario A, with f [=TFR/2] = 0.75, tpk = 30 yo, and sex ratio rho = 1.06.